Hammer Candlestick: What it is and how to use it

The cryptocurrency market can be tough to navigate at times. Market participants must conduct thorough technical analysis to succeed within the market — a candlestick chart is one of the most popular tools used to carry out technical analysis. If used correctly, they can be extremely helpful in noticing patterns and forming your trading strategies. Learning how to read them is not only beneficial for crypto trading but also for stock trading, forex trading, and other markets.
One of the most common candlestick patterns is the hammer candlestick pattern. This guide will explain the hammer candlestick pattern, what it looks like, and what it means.
What is the hammer candlestick pattern?
The hammer candlestick pattern can be utilized in most financial markets. It is a pattern that most traders like to see as the hammer candlestick is a bullish signal that announces a bullish reversal within the market. Once identified, it can be used alongside other trading methods and indicators. The hammer candlestick can signal an upcoming trend reversal, while other tools can help confirm the reversal.
What does the hammer pattern look like?
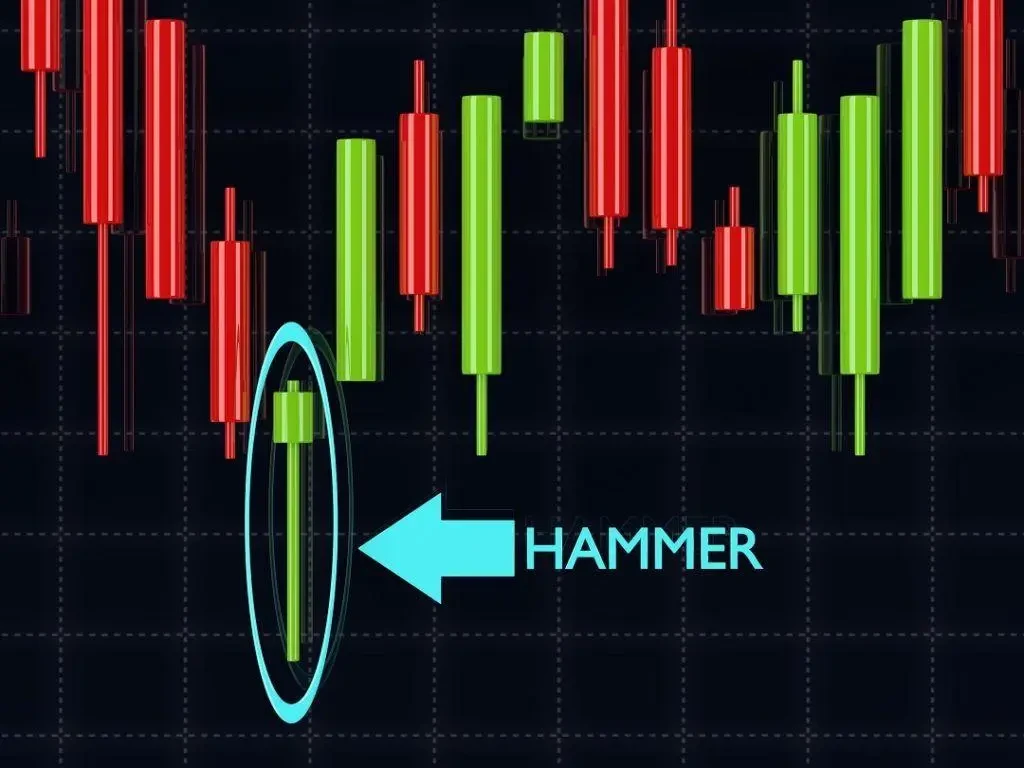
The hammer pattern is very easy to spot on a candlestick chart. It is a single candlestick pattern with a small body and a long downward wick.
The candlestick's success rate mainly depends on the length of the wick compared to the body. A strong hammer candlestick pattern has a wick that is two times the size of the body of the candle. Generally speaking, the longer the wick, the stronger the reversal.
Other variations of hammer candlesticks
Traditional hammer candlesticks signal bullish reversals. This can happen in any market; you can use it regardless of whether you are into crypto or forex trading.
However, a hammer candlestick can come in different shapes and forms, each with its own meaning. Some hammers are considered bullish hammers, while others are bearish. Here is a list of some other candlestick patterns.
1. Hammer candlestick
The first is the regular, traditional hammer candlestick. It is a bullish candlestick pattern formed when the closing price is above the opening price. As such, it suggests that the selling pressure was high, but the buyers took control of the market.
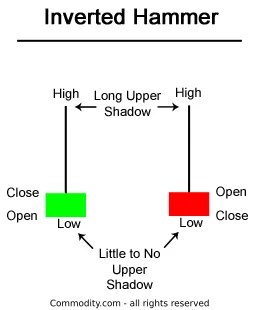
2. Inverted hammer candlestick
The second is the inverted hammer candlestick, which is another bullish signal. It forms when the opening price is below the closing price. However, this time, a long wick is above the candle's body. This suggests intense buying pressure was seeking to push the price up. However, it was eventually dragged back down before the candle could close. While this pattern is not as bullish as the regular hammer candlestick, it still signals a strong influence from the buyers.
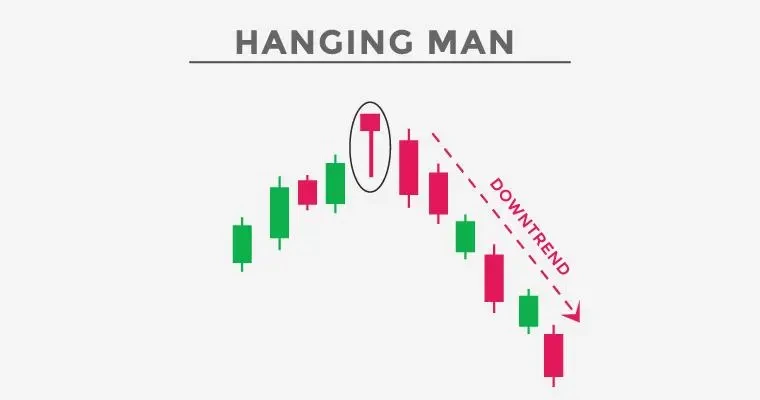
3. Hanging man candlestick
Next, we have a hammer that represents a bearish signal. It is known as the Hanging Man candlestick and forms when the open price is above the closing price, leading to a red candle. This hammer's lower wick is long, indicating that the market has experienced selling pressure. As the closing price is below the opening price, it's assumed sellers still have control of the market. This is why the hanging man candlestick is considered bearish.
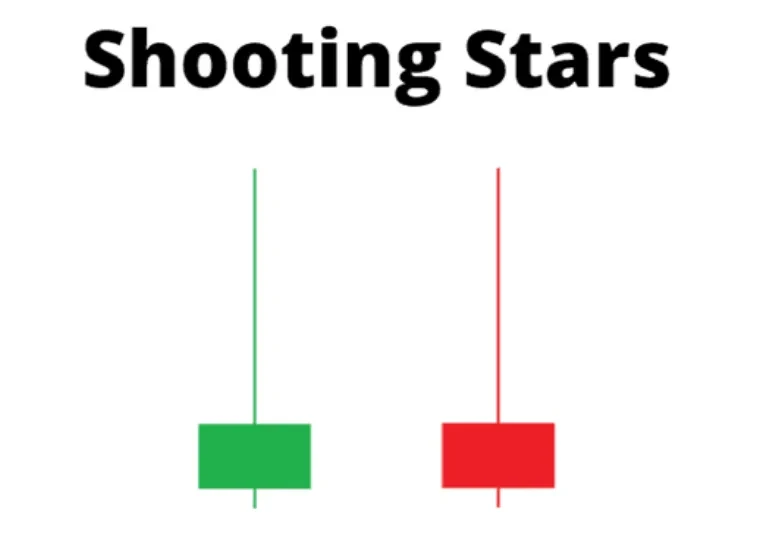
4. Shooting star candlestick
Finally, we have the shooting star candlestick, which is also a bearish pattern. It resembles a regular inverted hammer candlestick but announces a bearish reversal. They are formed when the price attempts to break out towards the upside, but ultimately, the candle closes below its opening price, suggesting an incoming bearish reversal.
How to trade with the hammer pattern?
Traders who spot one of the hammer patterns can use this knowledge to their advantage. As always, you should not rely on the hammer's appearance alone. The hammer candlestick should be used as a signal to look into the market. This typically involves consulting other technical indicators, such as moving averages. Fundamental analysis can also be useful, as it might reveal an event that sparked the growth of the buying pressure.
Advantages and limitations of the hammer candlestick pattern
The hammer candlestick pattern has its benefits as well as its limitations. To sum them up, we have created a pros and cons list for the hammer pattern.
Pros:
- It shows a reliable price trend in all financial markets
- It combines well with other price action tools
- Market participants can use the hammer as a trend reversal or trend continuation pattern
- Hammer candlesticks are easy to identify
Cons:
- It is not 100 percent reliable and might send a false signal. The price could still keep dropping even after a hammer appears
- Traders cannot rely solely on this single indicator and make their decisions on its appearance alone
Why you should remember the hammer candlestick pattern
Like other patterns that appear on charts, the hammer candlestick pattern has advantages and disadvantages. Its most significant drawback is that it could provide false signals. The appearance of a hammer candlestick suggests that a trend reversal was coming, but something may have disrupted it.
However, the hammer candlesticks are easy to spot, and show up relatively often. The only thing to remember is to wait to act on it, as you should always confirm the trend via other indicators. This is the risk that comes with trading cryptocurrencies. Their volatility makes it difficult to navigate the market, and participants must always be vigilant and cautious.
FAQs
Is a hammer bullish or bearish?
The regular hammer candlestick is a bullish signal. However, the hammer can appear in bearish forms, as explained in this guide. The two bearish forms that it takes are known as the hanging man and shooting star.
Where do hammer candlesticks form?
The hammer candlestick typically forms at the bottom of a downtrend. It is taken as a signal of a potential bullish reversal. However, it does not guarantee it, as the price could continue dropping despite its formation.
How to identify a hammer candlestick pattern?
Hammer candlesticks are defined by relatively small bodies with long wicks. The wicks are typically at least two times longer than the candle's body. This is considered a strong hammer, as the greater the length of the wick, the stronger the reversal.
Is hammer candlestick reliable?
The hammer candle is a good indicator of a trend reversal because it is easy to spot. However, it is not 100% reliable, and traders cannot act on it alone. They must remember to confirm the trend reversal's legitimacy through other means.
© 2025 OKX。 本文可以全文复制或分发,或使用不超过 100 字的摘录,前提是此类使用仅限非商业用途。对全文的复制或分发必须明确注明:“本文版权所有 © 2025 OKX,经许可使用。” 允许的摘录必须标明文章标题并注明出处,例如“文章标题,作者姓名 (如适用) ,© 2025 OKX”。不允许对本文进行任何衍生作品或其他用途。
相关信息:数字资产交易服务由 OKX Australia Pty Ltd (ABN 22 636 269 040) 提供;关于衍生品和杠杆交易的信息由 OKX Australia Financial Pty Ltd (ABN 14 145 724 509,AFSL 379035) 提供,仅适用于《2001年公司法》(Cth) 下定义的大额客户;其他产品和服务由提供这些产品和服务的相关 OKX 实体提供 (请参阅服务条款)。
本文所含信息仅为一般性信息,不应视为投资建议、个人推荐或购买任何加密货币或相关产品的要约或招揽。在做出决策前,您应自行进行研究并寻求专业建议,确保理解相关产品的风险。过去的表现并不代表未来的结果,切勿承担超过您能够承受的损失风险。如需了解更多信息,请阅读我们的服务条款和风险披露和免责声明。
本内容翻译与英文版本不一致时,以英文版本为准。